Every click tells
you something.
Clicks, sessions, pageviews, conversions. Broken down by country, device, referrer, campaign, and source. Real-time, not next-morning.
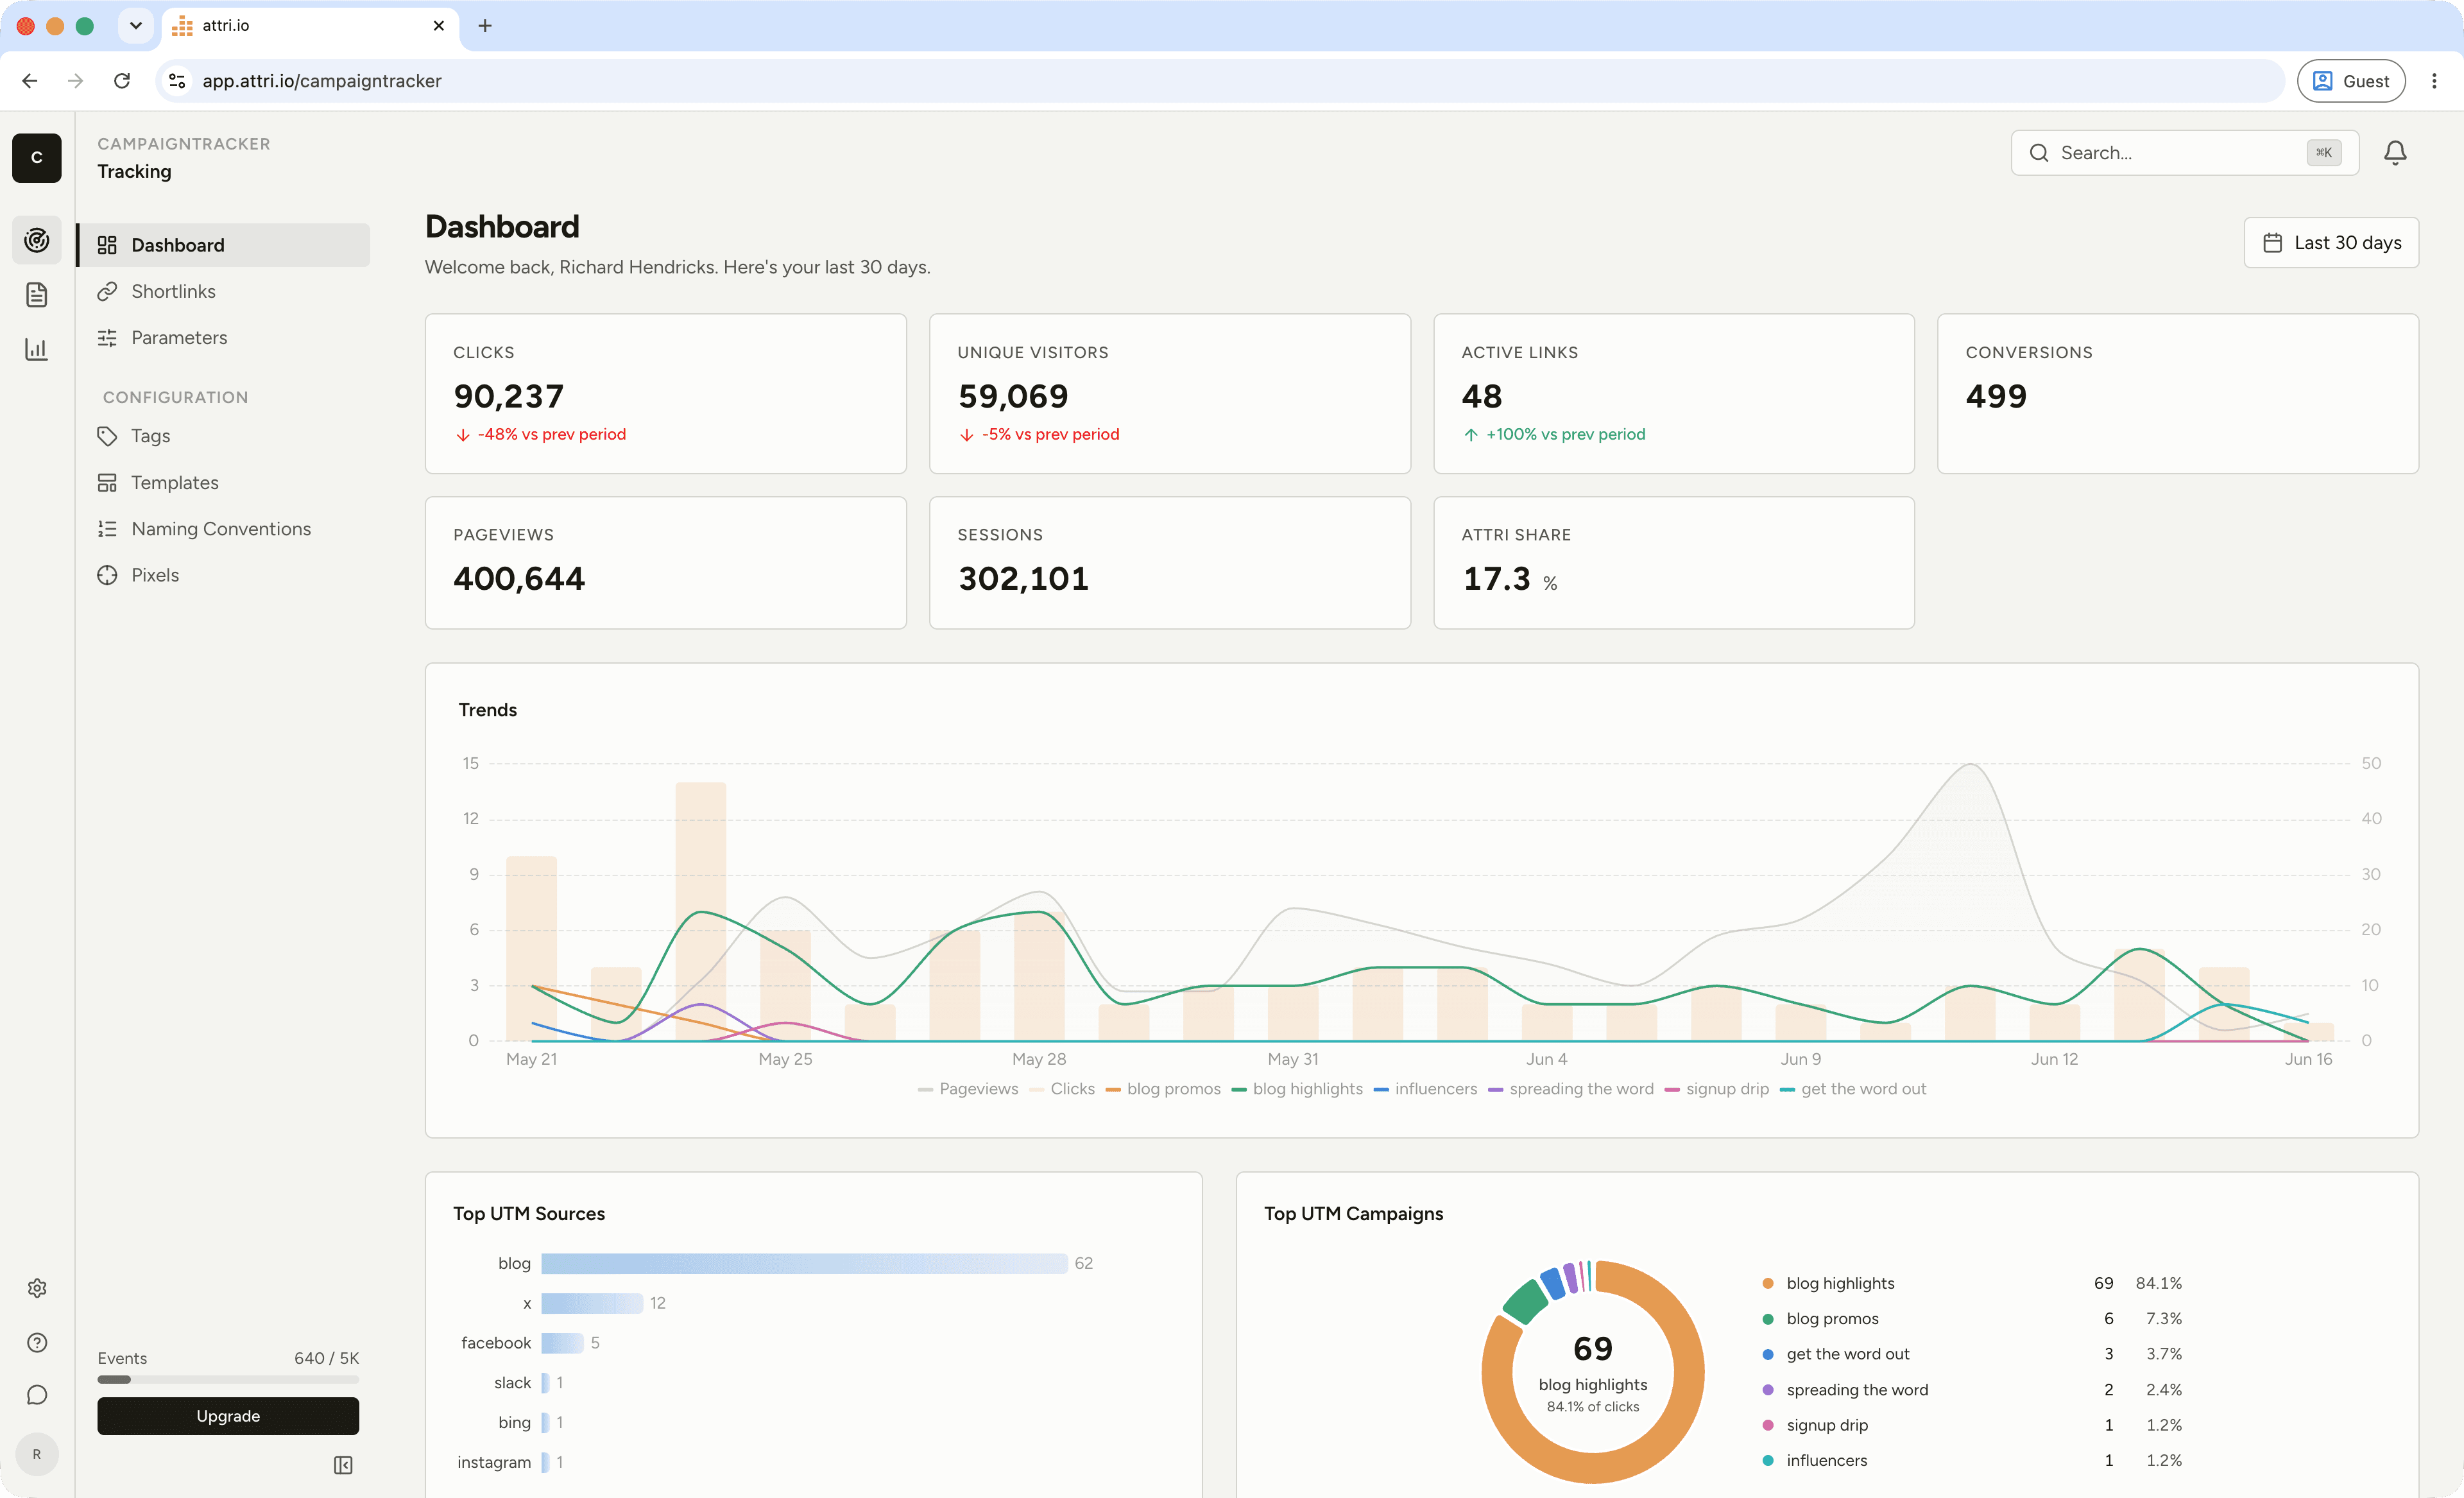
One screen. The whole picture.
Total clicks with period-over-period comparison. See the trend line, spot the spikes, and know which day your campaign actually landed.
Unique visitors with session tracking. First-touch attribution built in. Average session duration, pages per session, scroll depth.
Page-level tracking across your site. See which landing pages get traffic and which ones people actually stick around on.
Multi-line campaign performance chart. Compare campaigns side by side over any date range. See which ones are climbing and which plateaued.
Track form submissions, purchases, and custom events as conversions. Funnel visualization from impression to revenue.
Your best performing links ranked by clicks. See which content people actually click on, not just what you think they click on.
Slice it any way
you need.
Every click carries metadata. Country, city, device type, browser, OS, referrer source. Filter and group by any combination. Want to see mobile clicks from Germany on your LinkedIn campaign? Two clicks in the dashboard.
Set a target. Watch the pacing.
Pick a metric. Set a target. Choose an interval (daily, weekly, monthly, quarterly). Attri tracks progress and shows pacing so you know if you're ahead or behind before the period ends. Not after.
Any metric
Clicks, pageviews, sessions, form submissions, conversions, or custom events. Filter by source, campaign, country, or any parameter.
Pacing status
Progress bars with "on track", "behind", or "ahead" indicators. Based on where you should be at this point in the interval. Not just "50% done."
Notifications
Get notified when a goal hits its target or falls behind pace. Email or webhook. Don't find out at the end-of-month report.
Raw events.
Real time.
Every click, pageview, form submission, and custom event in a chronological log. Filter by event type, date, or any property. When something looks off in the aggregates, drill into the raw stream and find out why.
Not a sample. Every event.
Data retention by plan
Common questions
Is the analytics data real-time?
Yes. Clicks, pageviews, and events show up within seconds. There's no nightly batch job or 24-hour delay. When someone clicks your link, you see it.
Does Attri sample data or show all events?
All events. No sampling. Every click, pageview, and form submission is recorded individually. When you see "2,314 clicks", that's 2,314 actual click events, not an estimate.
Can I pull analytics data via the API?
Yes. The API exposes total clicks, timeseries data, and top-link rankings. Filter by date range, link, tag, or campaign. Build your own dashboards or pipe data into your existing BI tools. API reference.
How long is my data kept?
Depends on your plan. Free retains 30 days. Pro retains 1 year. Business retains 3 years. Scale retains 5 years. Enterprise gets unlimited retention.
What counts as an "event"?
Clicks (shortlink redirects), pageviews, form submissions, and any custom events you fire via the tracking snippet or API. All count toward your plan's event limit.
Can I set goals and track pacing?
Yes. Create goals against any metric with daily, weekly, monthly, or quarterly intervals. Attri shows progress bars with pacing indicators so you know if you're ahead or behind. Get notified when goals are hit or falling behind.
Your attribution
problem ends today.
Fourteen days of the full product. No card. If it doesn't save you more than it costs by week two, we'll ask why.